Over the holidays, I’ve taken my initial code to analyze Podlove downloads in R and have written a real R package for it.
Here it is it’s called podlover:
The package can do many more things than the functions before:
- Fetch necessary tables from the Wordpress MySQL
- Connect and clean tables for download analysis (either directly from the database or via local CSV files)
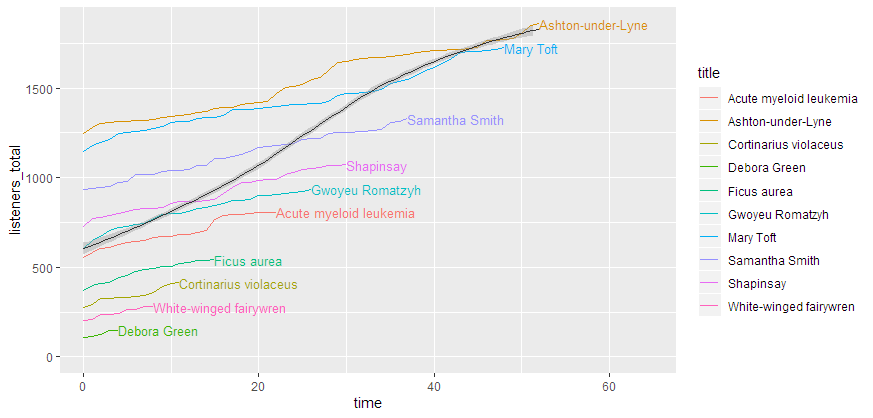
- Plot download curves by episode title, episode number, source, context, client_name, client_type, os_name or any other user-generated variable (plots are available with cumulated or non-cumulated data, with relative or absolute release dates, and with all kinds of graphical output options)
- Generate average performance tables per episode for total and average downloads as well as average downloads for specific periods (e.g. the first three days after launch)
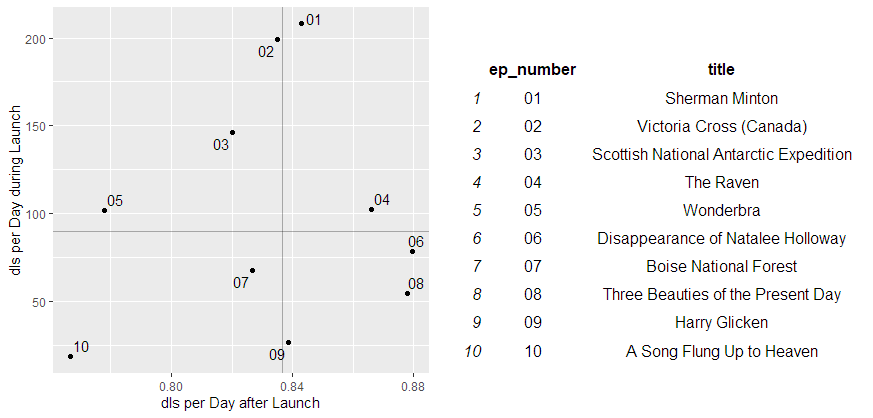
- Analyze performance of launch against post-launch in a four-box grid
- Create regression models of downloads against episodes or episode launch dates at a specific point in time (similar to @rahra 's approach), both as statistical models with coefficients and graphically
- Create example podcast data to play around with the package
All functions are documented in help files. The README.md on GitHub (=package vignette) shows many examples and details. Test, feedbacks and contributions are welcome!
4 Likes
Looks great - can your add-on work with show module podcasts?
Without knowing how shows are represented in the data, my guess is “not yet”. What I would need to know to estimate the effort is:
- Is there a fundamental difference in the data structure as opposed to single podcasts?
- Does use of the show module create new tables or change table definitions?
- What fields in which table define what show an episode belongs to?
The data structure is not different - I think there is just one more filter needed, where the podlove post id needs to be sorted a long the show module.
Shows module adds tables to term_taxonomy and terms and termmeta.
objectid in term_relationships references to the id of an episode in podlove_episode
So if I understand correctly, shows are related to posts in wp_posts. Is there a show identifier in wp_posts itself or does the post_id relate to another table containing the show label?
It’s a little more work than just the filter - I assume I will have to fetch an additional table to identify the show in a userfriendly way.
no objectid of terms_relationships references to the episode table of podlove of postid.
I’ve published V.1.3.0 of podlover, which includes:
- Add summary function option to
podlove_plot_curves(): This allows you to add an optional curve (e.g. median, mean, max…) to a multi-curve plot, giving a reference to the curves. This is especially useful in cominbation with the last_n option, as the summary curve will remain based on the whole set of downloads, not just the ones plotted.
- Add a
limit function to podlove_plot_curves(): In combination with the last_n and summary curve option, this allows you to see the either the full picture or just the ones of the last plotted curves.
- Add a
legend option to podlove_plot_curves(). This more classical way to show which curve is which can be used instead of labels inside the plot. Thanks to @PechGehabt for the idea!
- Updates to unit tests, vignette and readme
- Add new time scaling options to
podlove_plot_curves(): You can now use hourly, daily, weekly, monthly and yearly aggregations.
- Add new options for performance labelling: Allow choice of performance plot labelling variable and introduce a add legend option (displays a reference table)
Bugfixes
- Enlarge plotting area in curve plots to ensure labels aren’t cut off
- Reduction of unnecessary messages within functions
The new version can be installed as usual via devtools/GitHub:
# install devtools if you don't have it already
install.packages("devtools")

# install podlover from GitHub
devtools::install_github("lordyo/podlover")
Examples:
Multicurve with legend and aggregation function:
Performance Plot with new labels and legend:
Looks great - have you had the time to have a look at the show module?
I have received some sample data from a multi show podcast. I hope I can put that to good use.