Hi guys,
as indicated in other posts in this forum, it looks like the podlove team is working on an export feature for the analytics data. If, however, like me, you cannot wait to look at your downloads in excel, here is a simple workaround to get daily totals all the way back:
Step-by-step guide
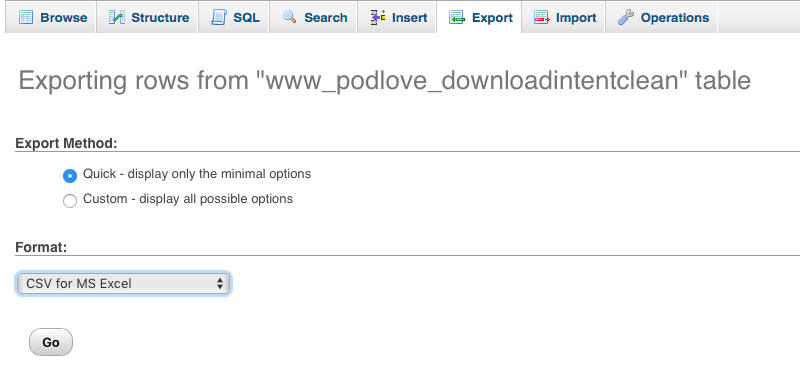
- Go to phpMyAdmin. There should be loads of databases, including www_podlove_downloadintentclean and www_podlove_downloadintent.
- We want to select www_podlove_downloadintentclean and then Export.
- Here I select CSV for Microsoft Excel because this includes one column with timestamps (Some other formats might work as well, some may shift the date to the left if a value is missing).
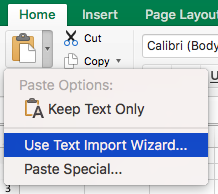
- Open the downloaded file in excel and copy the whole column with the dates. To prepare getting rid of the time behind the date in each cell, I paste the column into a plain text document and copy the whole thing from there.
- Open a new excel file, select cell A1. In the top left corner there is an arrow next to the paste symbol. If there is plain text in the clipboard (as should be after the previous step), this brings up a menu with the option Text Import Wizard.
- Select Delimited => Next
- Make sure Space is checked => Next
- Set the format to the correct time format => Finish.
Now we have two columns. One with the dates, one with the specific times.
- Add a top row to name the columns (like “Date” for A1 and “Time” for A2)
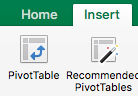
- Select the whole column with the dates (should be A) again, then Insert => Pivot Table and click OK
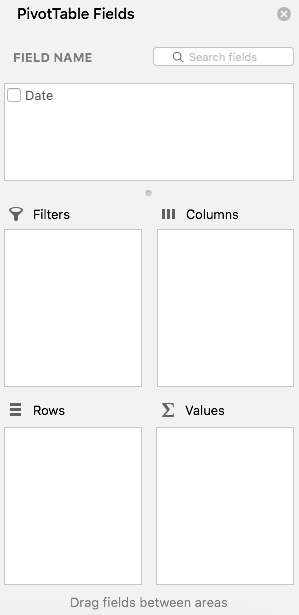
- In the Pivot Table Settings on the right side, check Date, then drag it into Rows
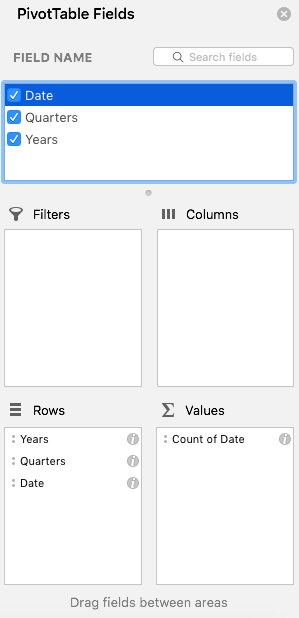
- In the Pivot Table itself, right-click any date (or year, month, quarter) and select Ungroup
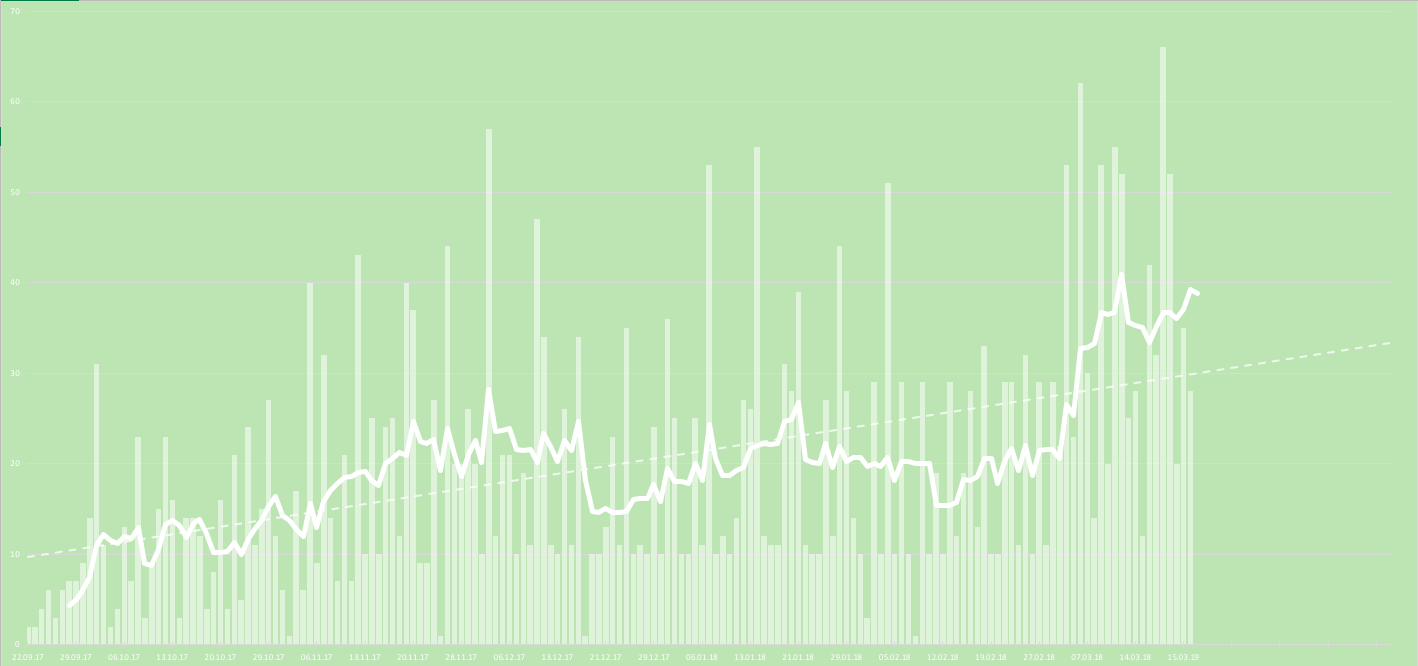
- With the table still selected, go to Insert and select the chart you want.
From there you can customise the chart whichever way you want (add means, trend-lines, etc). If you want to import new data, simply copy the values replacing the ones in the data sheet starting in the 2nd row (first row are still the labels). When importing new data like that, to update everything (if not done automatically) select Data => Refresh All.
Shortcut
As a quick shortcut, here is a document with some sample data in it. Feel free to download it, copy your data in there and modify the chart to your liking!
I am sure there are better ways of doing this, but this one was simple enough for me to figure out and quick enough to update the data every now and again 
Hope this helps!
Cheers!