Hi there,
I attach some screenshots in case someone needs additional data.
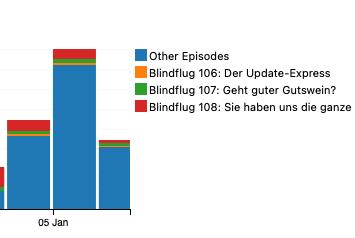
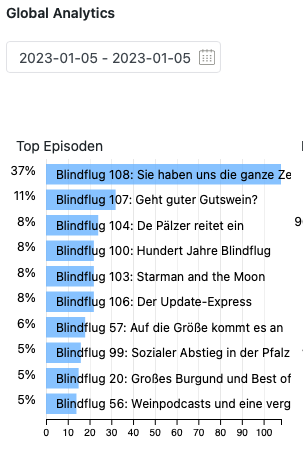
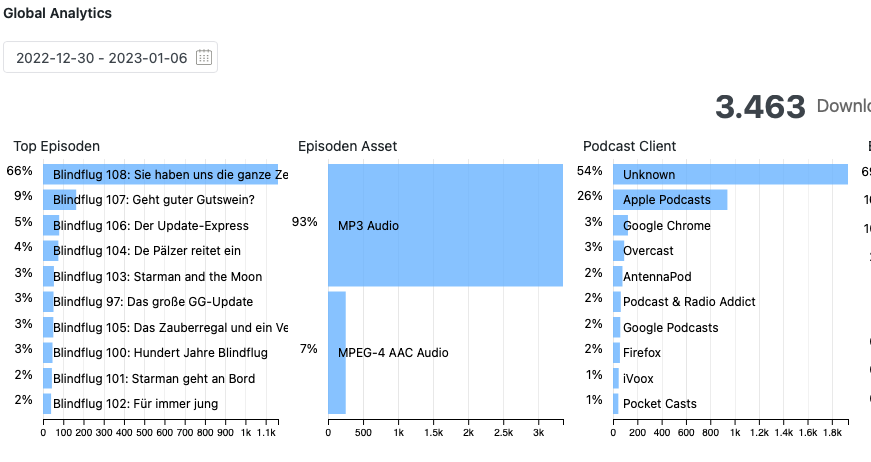
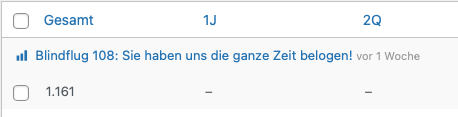
I have encountered this problem on numerous occasions: The last two days had me see a notable increase in usage. Someone seems to have mentioned the podcast somewhere but without a link (possibly another podcast) So the additional usage was not connected to additional traffic on my site and I had no chance to further specify whether the source mentioned the podcast in general or a specific episode). Trying to figure this out I set the date range on my statistics to ‚yesterday‘ and ‚last 7 days‘. For both date ranges the statistics stated the most recent episode as dominant traffic driver. However the graph as well as the numbers for this episode didn’t reflect this. The last day brought a 1.000 downloads of which 37% where supposed to be eoisode 108 (that would have been 370). The graph only shows 51. The 7 day overview stated 66% of 3463 downloads which would be 2285. The total downloads for the episode in ‚normal‘ mode are stated to be 1.161 (which is in line with the usual number of downloads in the first week). The numbers vary by 600 percent. Is this a bug or is there another way to find the true traffic driver?
Kind regards and thanks for all the great work.