As far as I know: 1d means “on the first day”. Not “the last 1 day(s)”.
However:
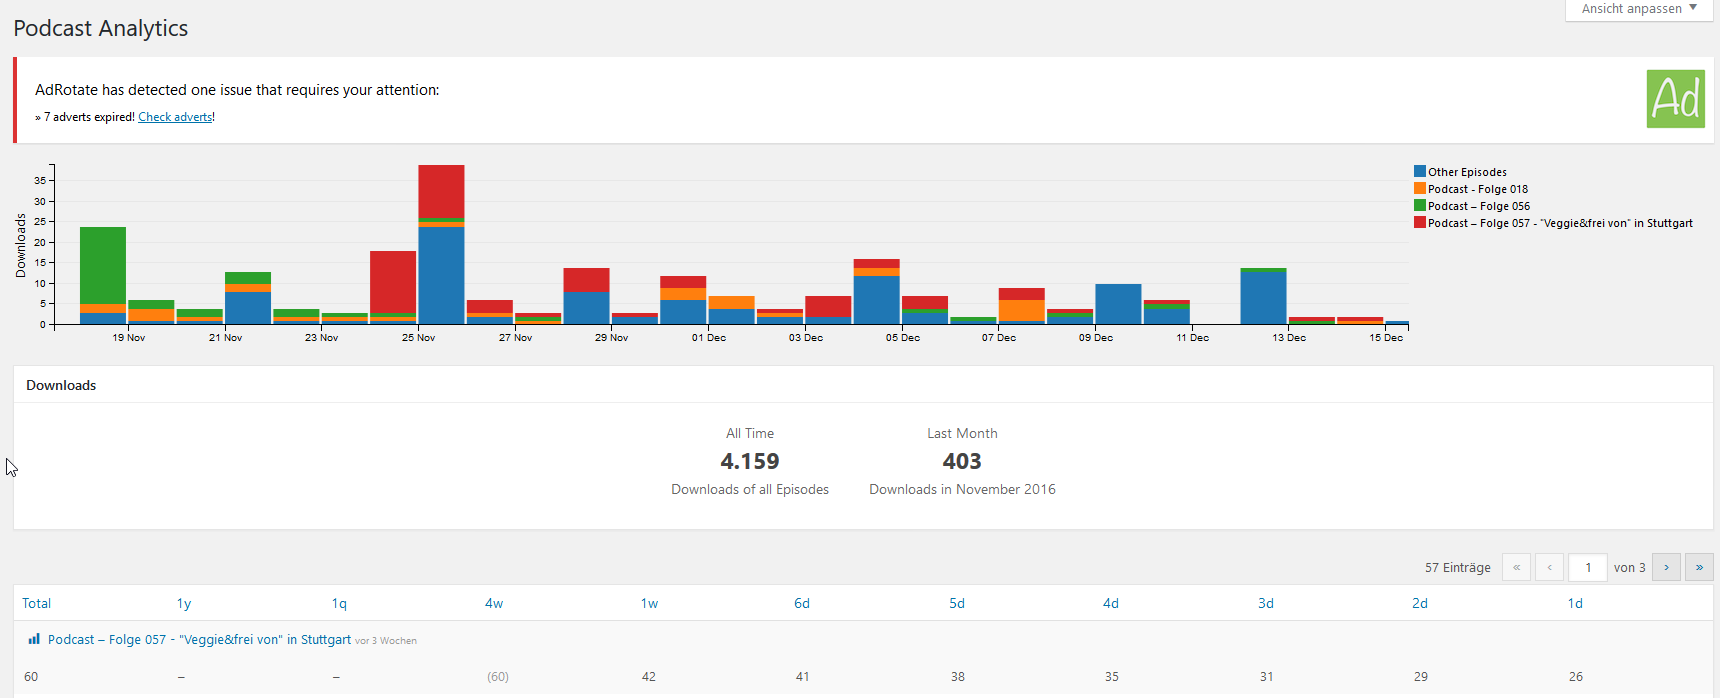
The red episode was released on Nov. 24th. The diagramm shows around 17 downloads for the red one. The table says 26 on day one. There might be something wrong. You can read it any way you want: There have never been 26 downloads of the red episode on one single day.
The developers would like bug reports as a GitHub issue.
The diagram represents absolute dates, the table represents numbers relative to each episode release. “1d” more accurately means “in the first 24 hours after release”. So unless you release each episode at midnight, table and diagram can’t be compared.