When I look at my metrics this morning, the bar graph is not displaying Episode 7, but it is showing Episode 6. Basically for some reason it has skipped Episode 7 on the bar graph. Could this be because there are hardly any Downloads for that episode in the period shown on the graph?
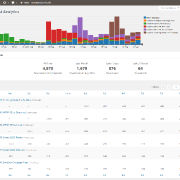
Last Week’s graph metrics:
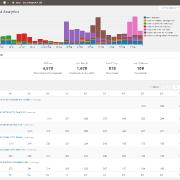
Today’s graph metrics: