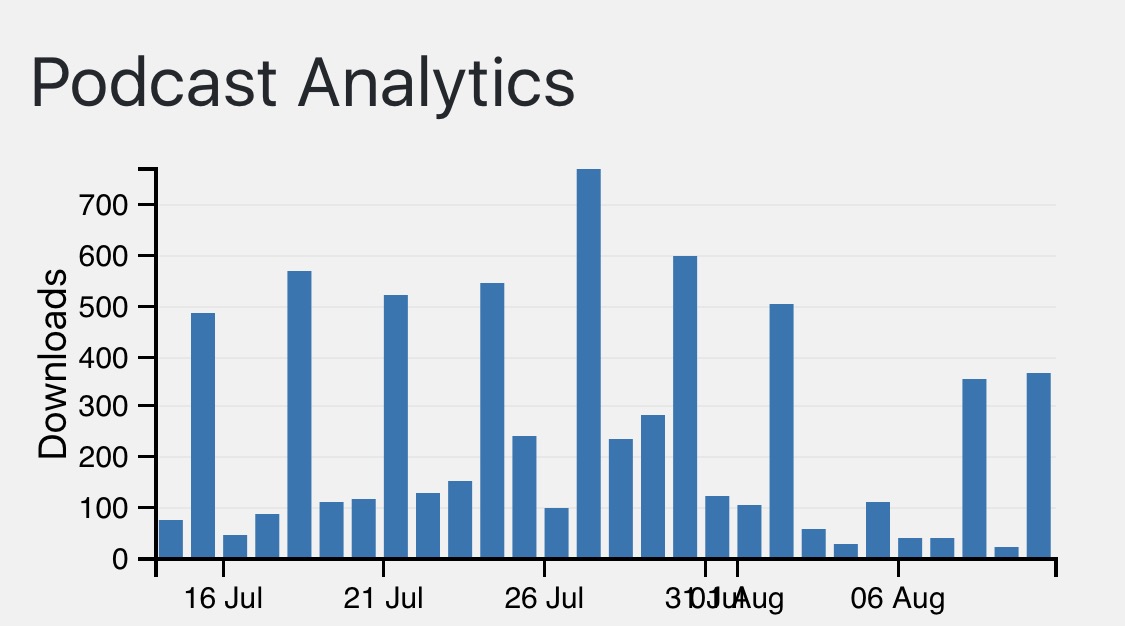
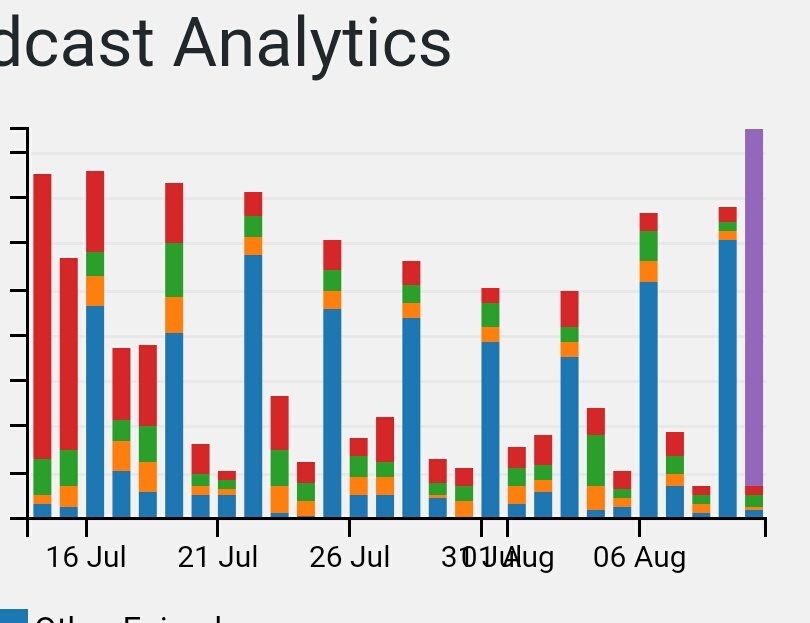
I use the podlove plugin since 2014 and had the analytics activated immediatly after they became available. In the last weeks I noticed a strange behaviour in the analytics visualisation of the monthly overview. Two consecutive days there are normal numbers of download intents (100 - 300 per day), followed by one day of unusally high download intents (500-700), and then two days of normal (lower) download intents. This patern repeated itself until today for over 4 weeks (see screenshots, first my own podcast, second another podcast, enoughtalk.de, with similar observations).
I tried multiple times to empty the cache, used the repair button and also switched the analytics tool off and on again. With no effect.
Any other idea what could be the cause. Otherwise I will stop worrying and learn to love the b… all the new listners that come by any third day.